Table of Contents
Marketers know that there is a wealth of data available for their sites. This data is easily available through a few Google tools: Google Analytics, Google Search Console, and Looker Studio.
Now, we can add BigQuery to the mix. Back in February, Google announced that users could export their Google Search Console data to BigQuery. Google has always pushed users to use its Google properties (remember Google+?), and this is no different.
Related Content:
While some might roll their eyes at Google this time, BigQuery has a number of advantages you can’t find with other Google tools (or can find as easily).
In this guide, we’ll go over BigQuery, how to get it set up, and how you can use it with Google Search Console.
What is BigQuery?
Let’s let Google explain that:
“BigQuery is a fully managed enterprise data warehouse that helps you manage and analyze your data with built-in features like machine learning, geospatial analysis, and business intelligence. BigQuery’s serverless architecture lets you use SQL queries to answer your organization’s biggest questions with zero infrastructure management. BigQuery’s scalable, distributed analysis engine lets you query terabytes in seconds and petabytes in minutes.”
The TLDR version of that is BigQuery lets you process a lot of information quickly. Plus, it can be an integral part of your analytics overview, helping you dive deeper into website metrics and user behavior.
Have you ever been in Excel or Google Sheets and tried filtering through a worksheet with hundreds of thousands of rows? Processing that much data through those programs is tough, and your computer probably froze.
BigQuery doesn’t have that problem.
What may take minutes of waiting in Google Sheets would take just seconds in BigQuery.
Eagle-eyed readers probably also spotted this line:
“BigQuery’s serverless architecture lets you use SQL queries to answer your organization’s biggest questions with zero infrastructure management.” So, what is SQL and what are SQL queries?
What is SQL?
SQL (pronounced ‘sequel’) is ‘structured query language’ used for processing, storing, and retrieving data from a relational database. In short, it lets you access what you want from a database.
On the outside, SQL is pretty easy to read and understand.
A basic SQL query follows the SELECT FROM WHERE order.
SELECT the information you want to see.
FROM the table you are using.
WHERE certain conditions are met.
Here’s a quick and very basic example:
SELECT all my web pages
FROM the dataset/table mywebsite.table
WHERE pages received more than 5000 views after March 1st, 2021.
There are countless SQL clauses and statements, but it doesn’t take too long to wrap your head around the basics.
How To Connect BigQuery and Google Search Console
Connecting the two Google tools is pretty easy, but it will take you a bit of time depending on where you are in the process.
1. Set up Billing
To connect BigQuery and Google Search Console, you should start by making sure you have billing engaged on your BigQuery account.
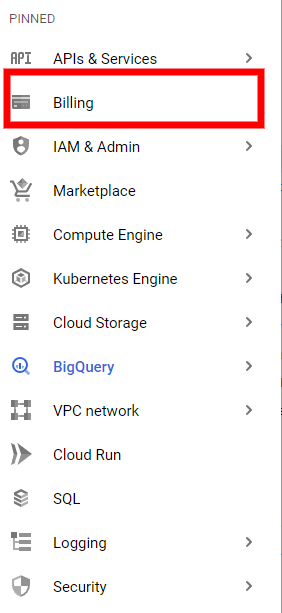
To do this, head over to BigQuery and select Billing from the side menu.
From there, you can either choose Link Billing Account or Manage Billing Account. If someone at your agency or organization already has a billing account, check with them and go through the Link Billing Account option.
If not, choose Manage Billing Account and walk through the steps.
Wait, I have to pay?
Just because you’re setting up a billing account doesn’t mean you will have to pay anything. It depends on how much you will be using BigQuery. If you plan on connecting a few sites from Google Search Console, your pay will likely be close to $0.
Here at Go Fish Digital, we run keyword tracking through a third-party tool into BigQuery for 100+ sites, have a handful of websites connected from GSC, and process over 5GB of queries daily.
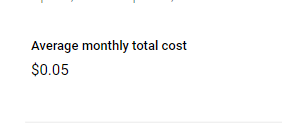
Our total cost?
Now, this does wildly depend on your circumstances. But for now, BigQuery pricing is fairly cheap. Processing 5 TB of queries per month is just $5.
For storage, it’s about $.02 per GB.
You can read more about BigQuery pricing here.
2. Set up the API
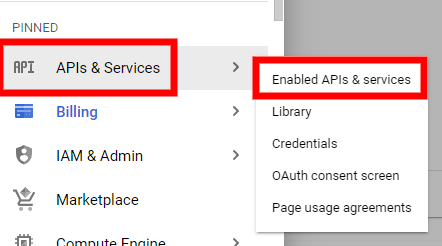
Go back into your side menu and go to APIS and Services→Enabled APIs and Services.
You’ll want to make sure BigQuery is enabled in order to connect to GSC.
You can scroll down and if you see BigQuery API in the list, you’re good to go.
If not, click on Enable APIS AND SERVICES at the top. Search for BigQuery API, select it, and then enable it.
3.Set up the Necessary Permissions
In order for Search Console and BigQuery to connect, you have to give BigQuery permission to access GSC data.
Go back to your side menu and click on IAM and Admin→IAM.
At the top, click on GRANT ACCESS.
Here, select New Principals and paste the account name:
search-console-data-export@system.gserviceaccount.com.
You’ll need to give it two new roles, BigQuery Job User and BigQuery Data Editor. Once you do that, hit save.
4. Connect Search Console To BigQuery
Almost to the end!
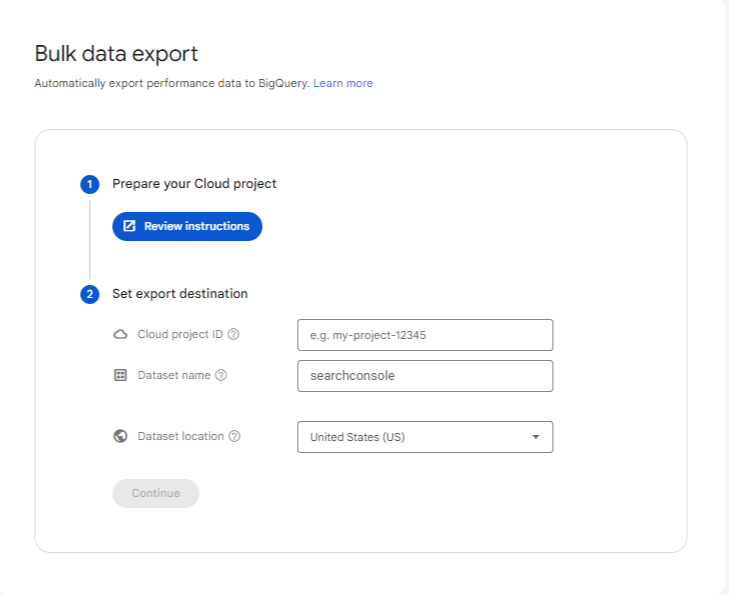
Go to Settings→Bulk Data Export.
Here, you’ll want to insert your Project ID which you can find here. This is case-sensitive, so copy it as you have it.
For the dataset name, you can leave it as searchconsole. Many online tutorials and queries have left it like that, making it easy to follow along.
Finally, click Continue, wait for it to confirm, and you’re finished!
It will take up to 48 hours for it to show up in BigQuery, but I’ve seen some data start populating after just 12 hours.
Navigating the SQL Workspace Dashboard
Once you start collecting data, now what?
Before we dive into some queries that we can begin using, let’s do a quick walkthrough of the SQL workspace dashboard.
On the left, you’ll see your project names, and that’s where you’ll find your project name. Under your project name, you’ll see your datasets and tables.
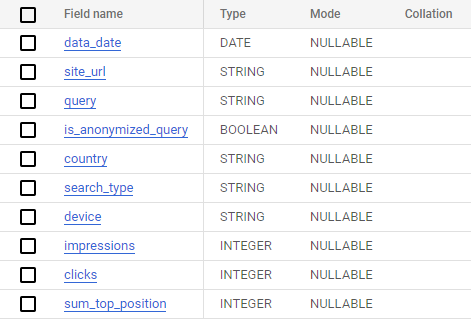
To start querying, you’ll want to click on one of the tables. When you do, you’ll see the table’s schema.
You can select Preview and see some of the information you’ll want to start querying.
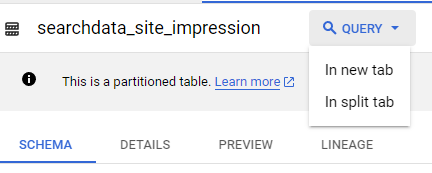
Above this, you’ll see a number of options, from Query to Export. To start a query, go ahead and click on Query. You can select ‘In new tab’ or ‘In split tab’.
Helpful SQL Queries for Google Search Console Data
Now to the writing queries part. As stated above, you don’t need to understand the ins and outs of SQL to make the best use of BigQuery.
Google has already published a few helpful queries that will get you started. These queries are simple and will help you start analyzing your data quickly.
Let’s go over a few basic ones before we dive into some unique queries.
All Web Stats for the Last X Time Period
SELECT
data_date AS date,
sum(impressions) AS impressions,
sum(clicks) as clicks,
sum(clicks) / sum(impressions) AS ctr,
((sum(sum_top_position) / sum(impressions)) + 1.0) AS avg_position
FROM searchconsole.searchdata_site_impression
WHERE search_type = 'WEB'
AND data_date between DATE_SUB(CURRENT_DATE(), INTERVAL 14 day) and CURRENT_DATE()
GROUP BY data_date
ORDER BY date desc;
This query will select all your web stats over the last two weeks. It will display the date, impressions, clicks, click-through rate, and average position.
This is a modified version of the first query from the list above because the one Google has will actually throw up an error in BigQuery.
I also removed the LIMIT so we can get more than 1000 results.
If you want to go back even further, you can change the number after INTERVAL to however many days you want. The INTERVAL will set the number of days from the CURRENT_DATE. So if you wanted to go back 30 days, you would change it to ‘INTERVAL 30 day’. If you wanted to go back 300 days, change it to ‘INTERVAL 300 day’.
All Traffic By URL
SELECT
url,
sum(impressions) as impressions,
sum(clicks) as clicks
FROM searchconsole.searchdata_url_impression
WHERE data_date between DATE_SUB(CURRENT_DATE(), INTERVAL 14 day) and CURRENT_DATE()
GROUP BY 1
ORDER BY 3 desc;
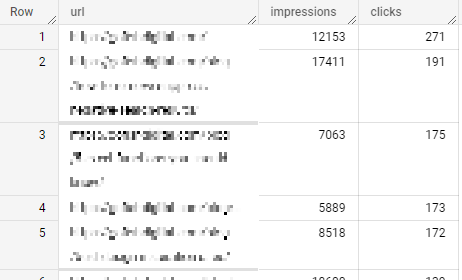
This is another Google-suggested query that was modified. This is an easy way to look at your clicks and impressions by URL.
Here’s what the report will look like:
While this looks almost identical to what GSC would export for you, this is handy for a few reasons:
- You can easily bypass the 1000-row limit GSC often puts on your exports.
- By creating this query, you can send it to Looker Studio “pre-filtered”. Too many filters can slow down Looker Studio reports.
Traffic by URL and Queries
SELECT
query,
url,
sum(impressions) AS impressions,
sum(clicks) AS clicks
FROM searchconsole.searchdata_url_impression
WHERE data_date between DATE_SUB(CURRENT_DATE(), INTERVAL 14 day) and CURRENT_DATE() /*can change the interval number and type for more or less data*/
AND query IS NOT null
GROUP BY 1,2
ORDER BY 2,3 desc;
One of the main frustrations with Google Search Console is that you can’t export all queries and their URLs together. If you want to look at keyword performance by page, you have to select the individual page over and over again. No more! Here is the query to select all keywords and their URLs for clicks and impressions.
This easily allows you to look at URL performance in batches instead of just filtering down to each individual URL.
URL and Query Traffic Comparison Over Time
SELECT
query,
url,
SUM(CASE WHEN data_date BETWEEN DATE_SUB(CURRENT_DATE(), INTERVAL 14 DAY) AND CURRENT_DATE() THEN impressions ELSE 0 END) AS impressions_14d,
SUM(CASE WHEN data_date BETWEEN DATE_SUB(CURRENT_DATE(), INTERVAL 14 DAY) AND CURRENT_DATE() THEN clicks ELSE 0 END) AS clicks_14d,
SUM(CASE WHEN data_date BETWEEN DATE_SUB(CURRENT_DATE(), INTERVAL 28 DAY) AND DATE_SUB(CURRENT_DATE(), INTERVAL 14 DAY) THEN impressions ELSE 0 END) AS impressions_14_28d,
SUM(CASE WHEN data_date BETWEEN DATE_SUB(CURRENT_DATE(), INTERVAL 28 DAY) AND DATE_SUB(CURRENT_DATE(), INTERVAL 14 DAY) THEN clicks ELSE 0 END) AS clicks_14_28d
FROM searchconsole.searchdata_url_impression
WHERE query IS NOT NULL
AND data_date BETWEEN DATE_SUB(CURRENT_DATE(), INTERVAL 28 DAY) AND CURRENT_DATE()
GROUP BY 1, 2
ORDER BY 2, 3 DESC;
This query will do the same thing as the above query and pull comparison data over the previous period.
In this particular example, it’s pulling data from the last 14 days and the preceding 14-day period.
If you want to adjust the time, you need to change the INTERVAL DAY number. For example, if you want to go back and review performance over the past 50 days and the 50-day period before that.
SELECT
query,
url,
SUM(CASE WHEN data_date BETWEEN DATE_SUB(CURRENT_DATE(), INTERVAL 50 DAY) AND CURRENT_DATE() THEN impressions ELSE 0 END) AS impressions_14d,
SUM(CASE WHEN data_date BETWEEN DATE_SUB(CURRENT_DATE(), INTERVAL 50 DAY) AND CURRENT_DATE() THEN clicks ELSE 0 END) AS clicks_14d,
SUM(CASE WHEN data_date BETWEEN DATE_SUB(CURRENT_DATE(), INTERVAL 100 DAY) AND DATE_SUB(CURRENT_DATE(), INTERVAL 50 DAY) THEN impressions ELSE 0 END) AS impressions_14_28d,
SUM(CASE WHEN data_date BETWEEN DATE_SUB(CURRENT_DATE(), INTERVAL 100 DAY) AND DATE_SUB(CURRENT_DATE(), INTERVAL 50 DAY) THEN clicks ELSE 0 END) AS clicks_14_28d
FROM searchconsole.searchdata_url_impression
WHERE query IS NOT NULL
AND data_date BETWEEN DATE_SUB(CURRENT_DATE(), INTERVAL 100 DAY) AND CURRENT_DATE()
GROUP BY 1, 2
ORDER BY 2, 3 DESC;
Top Stories
SELECT
COUNT(CASE
WHEN is_amp_top_stories=TRUE THEN 1
END
) AS top_stories,
data_date
FROM
`searchconsole.searchdata_url_impression`
WHERE
url IS NOT NULL
GROUP BY
data_date
HAVING COUNT(CASE WHEN is_amp_top_stories=TRUE THEN 1 END) > 0
ORDER BY
data_date DESC;
If you run a news site, then you’re probably interested in top stories. Unfortunately, GSC does not provide an easy way to look at Top Stories.
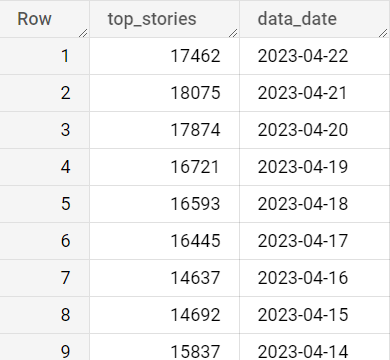
With BigQuery, you can look at how your Top Stories are performing. This query allows you to see how many times a story appeared in Top Stories.
The one drawback here is that it only tracks AMP top stories but can still provide a look into how your site is performing overall!
Here is an example of the results:
You can also modify this query to look at which URLs are appearing the most in Top Stories.
SELECT
url,
COUNT(CASE
WHEN is_amp_top_stories=TRUE THEN 1
END
) AS top_stories
FROM
`brobiblegsc.searchconsole.searchdata_url_impression`
WHERE
url IS NOT NULL
GROUP BY
data_date,
url
HAVING top_stories>1
ORDER BY
top_stories DESC;
If you want to see data on your Top Stories, you can use the following query:
SELECT
url,
sum(impressions) AS impressions,
sum(clicks) AS clicks,
sum(clicks) / sum(impressions) AS click_through_rate
FROM searchconsole.searchdata_url_impression
WHERE search_type = 'WEB'
AND is_amp_top_stories = true
AND data_date between DATE_SUB(CURRENT_DATE(), INTERVAL 14 day) and CURRENT_DATE()
GROUP BY 1
ORDER BY impressions DESC;
This will show you the clicks, impressions, and click-through rates of your articles that are appearing in top stories.
In fact, you can run similar queries using any of the snippet options BigQuery has.
Conclusion
As you can see, there are plenty of options for using BigQuery and GSC. You can grab a lot of data in just a few clicks, export it to your reports, and gain better insights into your organic performance.
Any questions? Be sure to reach out so we can talk about your digital marketing strategy and goals.
Search News Straight To Your Inbox
*Required
Join thousands of marketers to get the best search news in under 5 minutes. Get resources, tips and more with The Splash newsletter:
